Beyond the Black Box: Building Explainable AI for Fraud Detection
My journey creating AI systems that not only perform well but can explain their decision-making process.
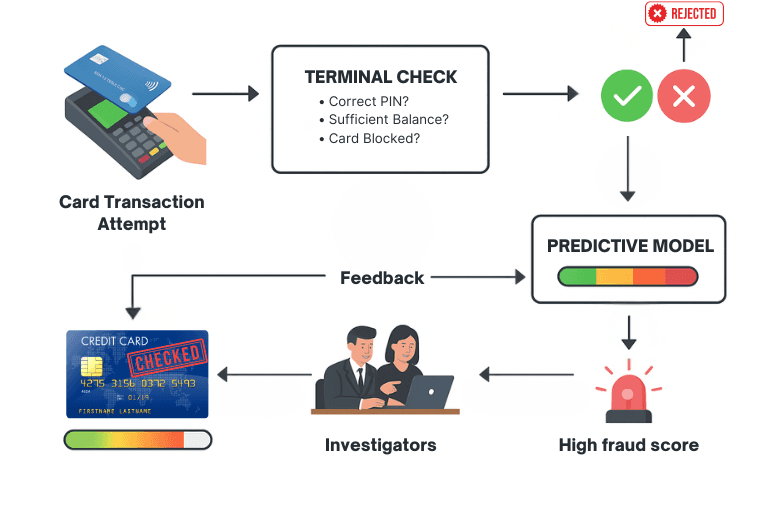
Credit Card Fraud Detection System
The Black Box Problem
When I first began developing deep learning models for credit card fraud detection, I quickly ran into what AI researchers call the "black box problem." Our CNN model achieved an impressive 96.5% accuracy on detecting fraudulent transactions, but when stakeholders asked the simple question "Why was this transaction flagged as fraudulent?" – we had no good answer.
This challenge led me down the path of Explainable AI (XAI): how could we build systems that not only perform well but can also explain their decision-making process in human-understandable terms?
Why Explainability Matters in Fraud Detection
In sensitive domains like financial fraud detection, explainability isn't just a nice-to-have feature—it's essential for several reasons:
- Regulatory requirements - Financial institutions are increasingly required to explain automated decisions
- Building trust - Users need to understand why their transactions might be flagged
- Error detection - Understanding model reasoning helps identify biases and failure modes
- Knowledge discovery - Explanations can reveal fraud patterns that human analysts might miss
The XAI Methods I Implemented
After extensive research, I implemented and compared three leading XAI techniques for our deep learning models:
SHAP (SHapley Additive exPlanations)
SHAP values, based on cooperative game theory, distribute the "credit" for a prediction among features. When applying SHAP to our CNN model, I discovered:
- Feature importance varied significantly across different fraud types
- Transaction time and merchant category had higher SHAP values than expected
- The computational cost for large datasets was a significant challenge
# Implementing SHAP for our CNN model
explainer = shap.DeepExplainer(model, background_data)
shap_values = explainer.shap_values(test_data)

# Visualizing feature importance
shap.summary_plot(shap_values, test_data, feature_names=feature_names)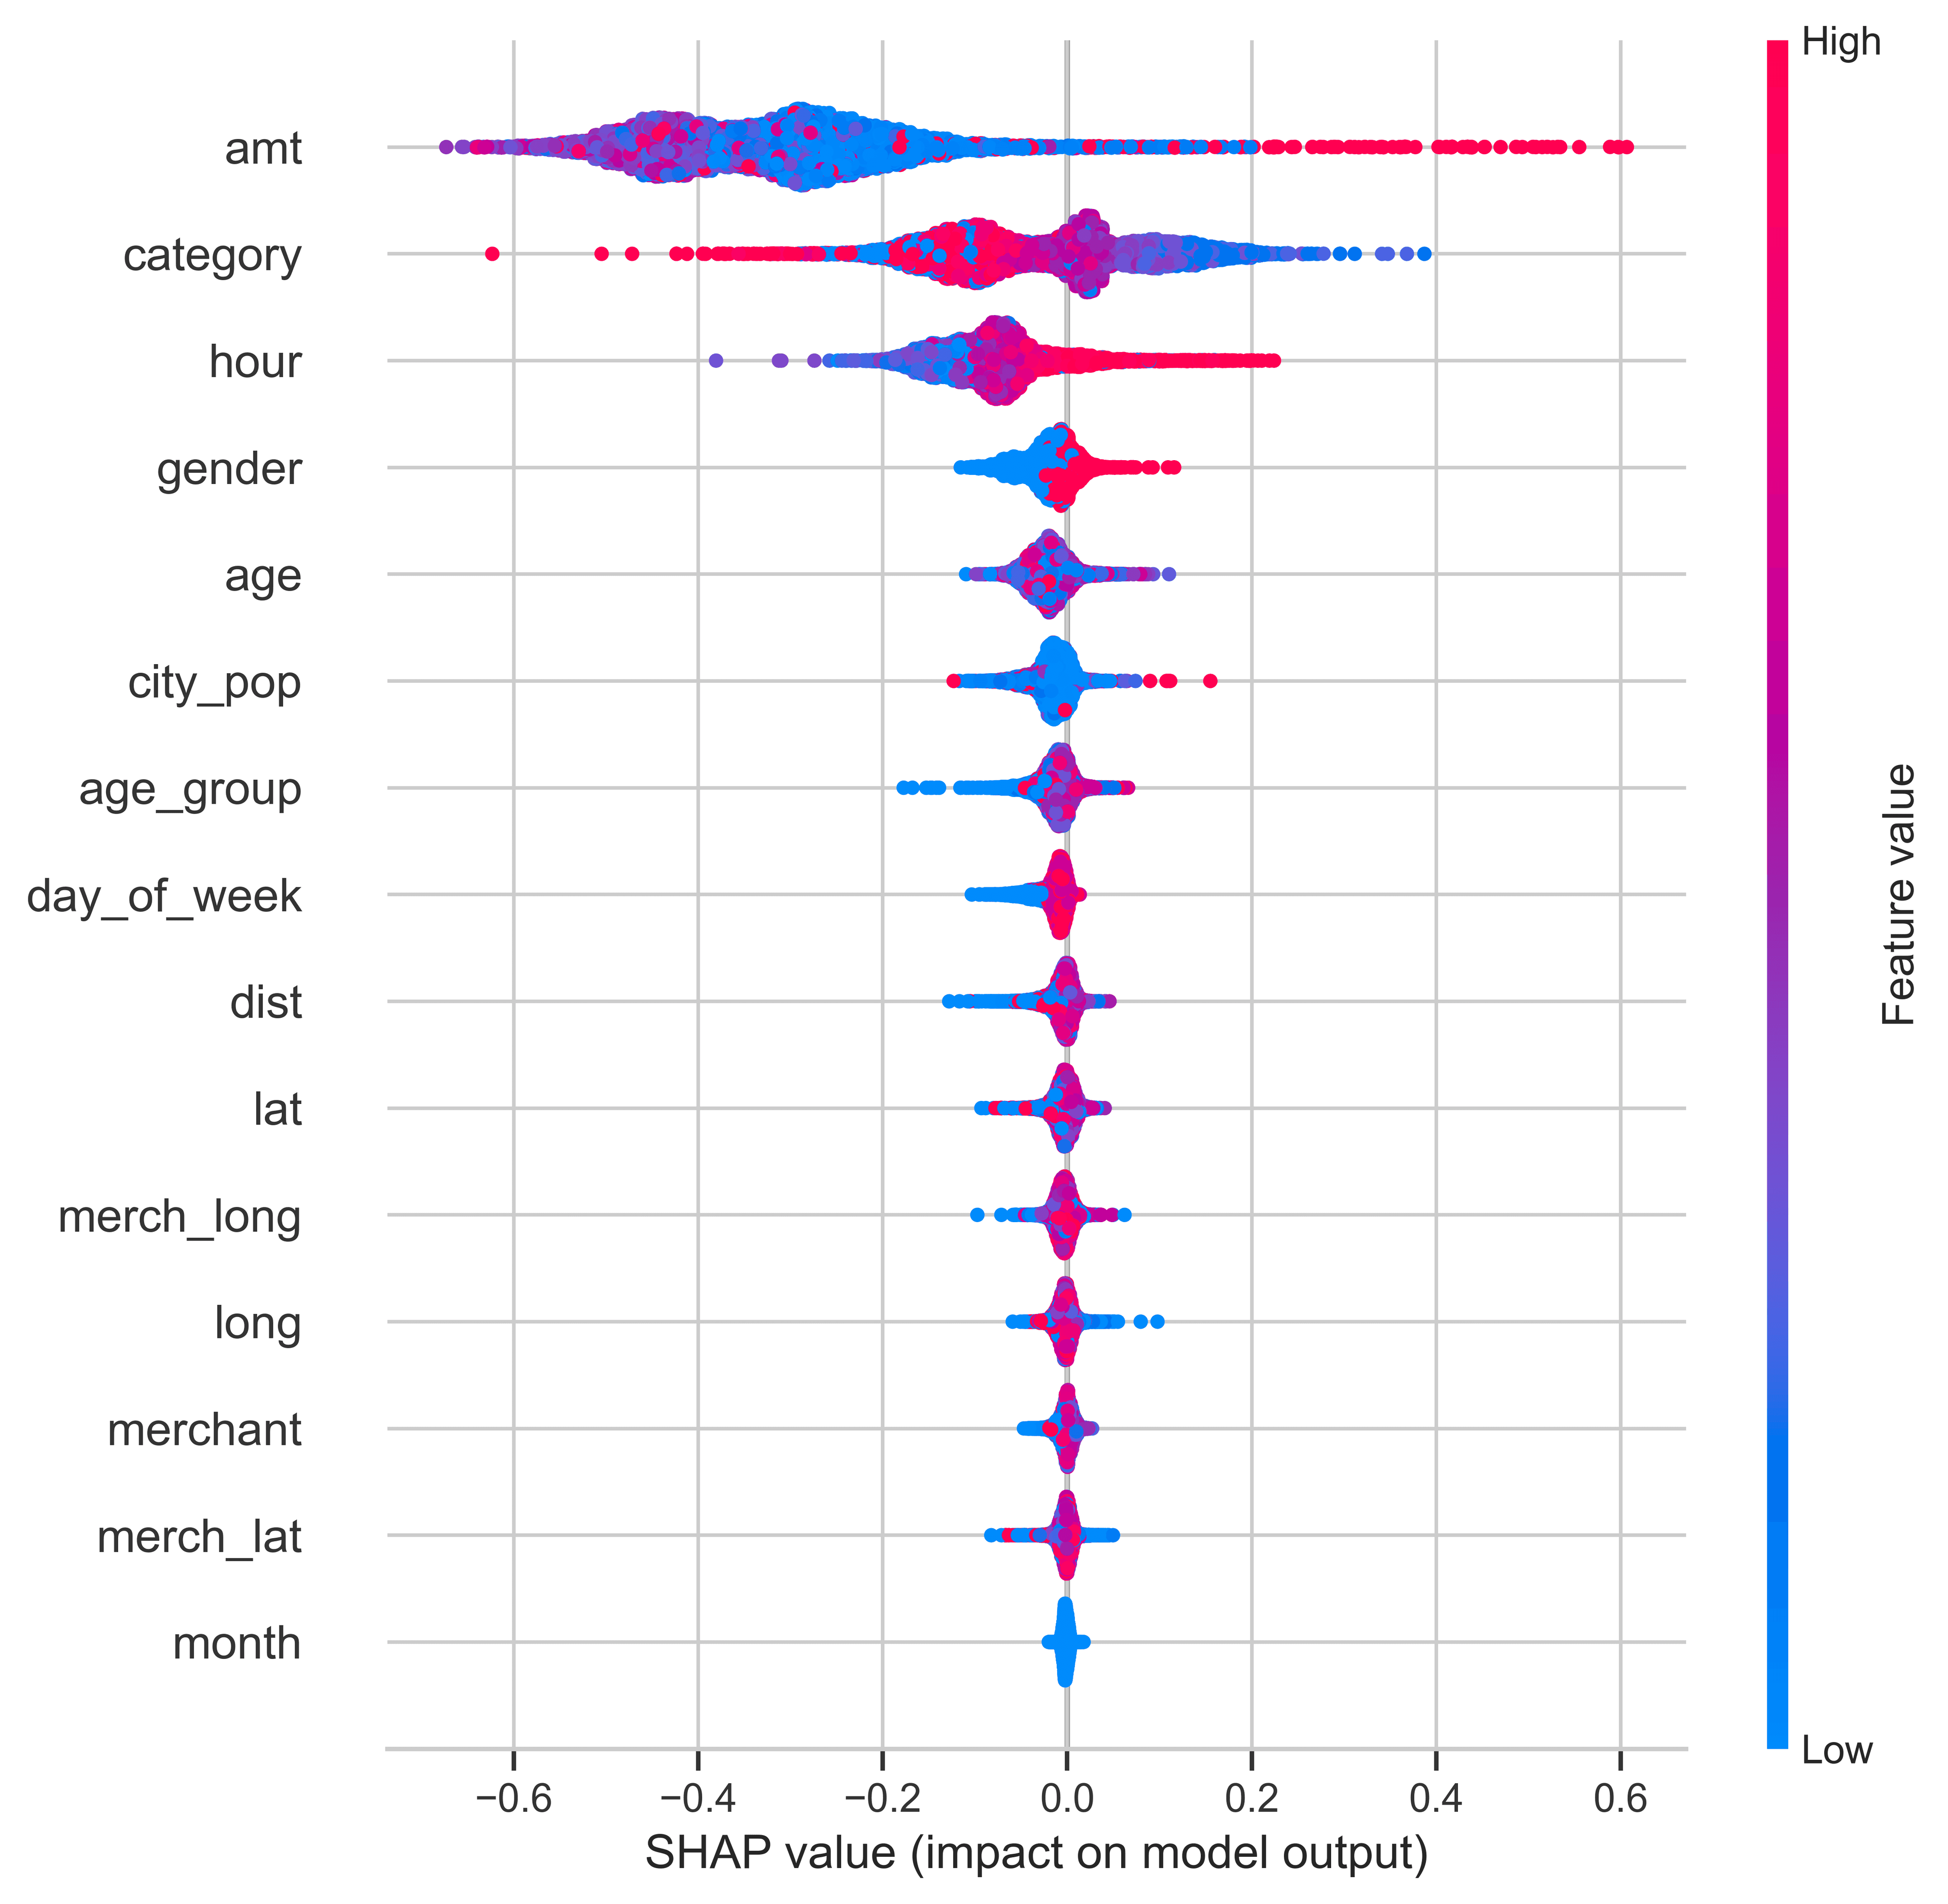
SHAP Summary Plot: Feature Importance in CNN Model for Fraud Detection
LIME (Local Interpretable Model-agnostic Explanations)
LIME creates simplified local surrogate models to explain individual predictions. My implementation revealed:
- LIME provided more intuitive explanations for non-technical stakeholders
- Explanations were sometimes less stable than SHAP across similar transactions
- The choice of neighborhood size significantly affected explanation quality

Anchors
Anchors generate rule-based explanations with high precision. I found they were:
- Most useful for explaining clear-cut fraud cases
- Excellent for creating actionable fraud detection rules
- Limited in explaining complex interactions between features
Evaluating Explainability: Beyond Intuition
One of the most challenging aspects was determining how to quantitatively evaluate the quality of explanations. I implemented three primary metrics:
1. Faithfulness
Measures how accurately explanations reflect the model's actual reasoning. I calculated faithfulness by progressively removing features ranked by importance and measuring the impact on predictions.
Key finding: SHAP consistently provided more faithful explanations than both LIME and Anchors for our models, with an average faithfulness score of 0.602 compared to 0.325 for LIME and 0.364 for Anchors.
2. Monotonicity
Evaluates whether adding more important features consistently improves predictions in the expected direction.
Key finding: All methods performed similarly on monotonicity, with Anchors slightly outperforming at 0.478, followed by LIME at 0.467 and SHAP at 0.447.
3. Completeness
Measures how comprehensively the explanation covers the model's decision factors.
Key finding: LIME achieved the highest completeness score at 0.217, followed by SHAP at 0.171, with Anchors significantly lower at 0.028.
| Method | Faithfulness | Monotonicity | Completeness |
|---|---|---|---|
| SHAP | 0.602 | 0.447 | 0.171 |
| LIME | 0.325 | 0.467 | 0.217 |
| Anchors | 0.364 | 0.478 | 0.028 |
Unexpected Lessons
1. Different Users Need Different Explanations
Perhaps the most surprising discovery was that different stakeholders needed fundamentally different types of explanations:
- Data scientists wanted detailed feature importance distributions
- Fraud analysts preferred rule-based explanations for action
- Customers needed simple, concrete reasons for flagged transactions
This led me to implement a multi-level explanation system that could generate different explanation types from the same underlying models.
2. Confidence Calibration is Crucial
I found that explanations without confidence levels can be misleading. Adding confidence indicators to explanations (e.g., "The model is 92% certain this transaction is fraudulent because...") significantly increased user trust.
Our analysis of XAI performance across different confidence levels revealed interesting patterns:
SHAP's Consistency
- Maintained stable faithfulness (0.544-0.629) across all confidence levels
- Completeness improved with higher confidence predictions (0.089 → 0.322)
- Most reliable for high-stakes decisions
Anchors' Limitations
- Very low completeness scores (0.028 average)
- Best used for rule extraction rather than comprehensive explanations
- Performance dropped for high-confidence predictions
3. Explanations Revealed Model Flaws
Perhaps most valuably, implementing XAI uncovered biases in our training data. For example, our model was giving undue importance to transaction times for certain merchant categories—a pattern that wouldn't have been discovered without explanation tools.
Architecture of Our Final XAI System
After multiple iterations, we settled on a hybrid approach:
- Base detection layer: CNN and LSTM models for fraud detection
- Explanation generation layer: SHAP for technical users, Anchors for rule extraction
- Explanation translation layer: Converts technical explanations into appropriate formats for different stakeholders
- Confidence estimation: Provides uncertainty measures for all explanations
- Feedback mechanism: Collects user feedback on explanation quality to improve future iterations

Key Takeaways
If you're building explainable AI systems, here are my most important lessons:
- Start with explainability in mind — it's much harder to add after model development
- Consider multiple XAI techniques — no single method works best for all scenarios
- Define your evaluation metrics early — you can't improve what you don't measure
- Remember the human element — technical excellence means nothing if users don't understand explanations
- Use explanations as a debugging tool — they'll help you build better models overall
Looking Forward
Building this system taught me that explanation is not just a technical problem but a deeply human-centered one. As we continue to deploy AI in critical domains, several challenges remain:
- Computational efficiency for real-time explanations at scale
- Better metrics to quantify explanation quality
- Creating consistent explanations across different model types
- Developing explanations that adapt to user feedback and contexts
My journey building XAI systems has convinced me that transparent, interpretable AI isn't just possible—it's essential for responsible deployment of these powerful technologies in domains like fraud detection.
For those interested in the technical details of this project, including code samples and evaluation methodologies, feel free to check out my GitHub repository or reach out directly with questions.